
- Home
- New
- Data
All Datasets
Search by discipline
Search by data type
Search by temporal resolution
Search by time coverage
- Projects
Argo Products
 OFES
OFES Climate Indices
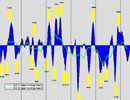 Hawaii Regional Forecast
 Hawaii Regional Climate Model
 Hawaii Regional Ocean Model
 Hawaii Regional Page
 High Wind Occurrence
 iROAM
iROAM LADCP
LADCP Mean Dynamic Ocean Topography
 Monsoon Monitoring
 Pacific Argo Regional Center
 PRIDE
PRIDE Paleoclimate Modeling
 Precipitation Prediction System
 SCUD
SCUD Science on a Sphere
& Magic PlanetSPEArTC Statistical Downscaling
- Servers
Web-based servers
OPeNDAP servers
- Tutorials
- IPRC

- Our Mission
- Project Background
- Hindcast Skills
- Real-time prediction
- Previous Forecast
- References
- New Project page
Hindcast Skills
c. Skill of ENSO hindcasts
1. SST along the equatorial Pacific:
Figure 2 shows ACC (Fig. 2a) and RMSE (Fig. 2c) estimated at all lead times (0-8 months), and for ICs ranging from January through December for Niño3.4 SST anomalies. The corresponding measures estimated from persistence are shown in Figs. 2b and 2d. The inverse association between ACC and RMSE holds good, but ensemble mean offers higher skills than those measured by persistence forecast. For instance, for leads up to 6-7 months and hindcasts initialized during late spring through early fall (May through October), the ensemble mean ACC is > 0.8 with relatively less RMSE (0.3-0.4) while for persistence method, ACC drops below 0.6 with higher RMSE (~0.7-0.8). For forecasts initialized during February through April, ensemble mean forecast is favored over persistence. However, for forecasts initialized during late boreal fall and winter (November through January) skill in hindcasting the transition phase of ENSO is modest at best. Specifically, both methods yield indistinguishable ACC and RMSE in the first 3-5 months (Figs. 2a-d), and the values drops off rapidly during spring attaining a minimum skill in July.
While results presented in Fig. 2 suggest over-all skill, an assessment over the time evolution (Fig. 3a) illustrates the model’s skill between individual El Niño and La Nina events. During the period 1982-2005, for instance, two of the strongest El Niño of the 20th century (1982 and 1997), prolonged El Niño during 1991-94, and persistent La Nina during 1998-2000 are noteworthy observed features (thick red in Fig. 3a). For the peak phase of ENSO (December through February; DJF), and at 0-month lead CFS ensemble mean (thick blue) hindcasts these observed features, barring the amplitude during the persistent cold phase (Fig. 3a). Another point of note is that all ensemble members (green) capture correctly the amplitude during 1982 and 1997, and the model’s ability in hindcasting these two El Niño events is remarkable even for leads up to 6 months (not shown). One prominent weakness of CFS is that the ensemble spread is high during 1998-2001, and the predicted amplitude of cold events is higher than observed. Table 1 summarizes the statistics for Niño3.4 at various leads and for all the four seasons. While ACC remains high for fall, winter and spring seasons, the skill drops off markedly for summer at longer lead time. On the other hand, for DJF while ACC remains around 0.9 at all leads, S/N, a measure of the spread, drops off by a factor of ~ 2.7 (from 6.1 to 2.3).
Next we checked CFS skill in forecasting different flavors of El Niño (Figs. 3b-c). Specifically, observations indicate that SST maximum for cold tongue El Niño (CT_EN) events is noted over the eastern Pacific (5oS-5oN, 90oW-150oW), and that for warm pool El Niño (WP_EN) events over the western-central Pacific region (5oS-5oN, 160oE-150oW). Note that during CT_EN events warm SST anomalies extend westwards but maximum amplitude is noted over the cold tongue region (Kug et al. 2009). At 0 month lead, WP_EN events (1990-91; 1994-95; 2002-03 and 2004-05) are forecast with minimum spread (Fig. 3b) and high ACC (0.95), and S/N > 5.0 (not shown). The skill for CT_EN events is as good as that over the Niño3.4 region. Owing to the role of ocean dynamics, at 6-month lead time, while the ACC drops to 0.77 for WP_EN events, it remains high at 0.9 for CT_EN events (not shown). An examination of DJF SST anomalies during individual WP_EN events indicates that the model is successful in capturing the local SST maxima around the dateline (Sooraj et al. 2010).
2. Precipitation along the equatorial Pacific
Fig. 3d shows precipitation skill along the equatorial Pacific (170oE-110oW; 10oS-5oN) at 0-month lead for DJF season. While the ensemble mean follows the observed, the spread among the ensemble members is larger yielding S/N of about 4.2, considerably less than that for SST anomaly hindcast (Table 1). Some limitations in precipitation forecast include stronger amplitude during the winter of 1997/98, and the failure of capturing the above normal rainfall during the winter of 1986-87. Despite forecasting stronger SST anomalies during cold phases (e.g., 1983-84; 1998-99; Fig. 3a), the anomalous precipitation forecast is weaker than observed (Fig. 3d).
To consolidate the skill, Figs. 2e-f show ACC and RMSE for leads ranging from 0 to 8 months and for all ICs. ACC > 0.7 with less RMSE lie along the diagonal representing fall and winter seasons. Only for short lead times (0-2 months), predicting spring and summer rainfall is skilful. Similar to SST, forecasting precipitation anomalies during ENSO phase transition is difficult.
The APDRC may be acknowledged as follows: Data provided by
Asia-Pacific Data Research Center, |
Questions, Comments? |