
- Home
- New
- Data
All Datasets
Search by discipline
Search by data type
Search by temporal resolution
Search by time coverage
- Projects
Argo Products
 OFES
OFES Climate Indices
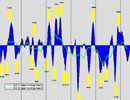 Hawaii Regional Forecast
 Hawaii Regional Climate Model
 Hawaii Regional Ocean Model
 Hawaii Regional Page
 High Wind Occurrence
 iROAM
iROAM LADCP
LADCP Mean Dynamic Ocean Topography
 Monsoon Monitoring
 Pacific Argo Regional Center
 PRIDE
PRIDE Paleoclimate Modeling
 Precipitation Prediction System
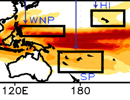 SCUD
SCUD Science on a Sphere
& Magic PlanetSPEArTC Statistical Downscaling
- Servers
Web-based servers
OPeNDAP servers
- Tutorials
- IPRC

- Our Mission
- Project Background
- Hindcast Skills
- Real-time prediction
- Previous Forecast
- References
- New Project page
Hindcast Skills
d. Skill of Precipitation hindcasts over the USAPI
1. West Pacific Islands
Figure 4 shows rainfall forecast over west Pacific islands (125oE-165oE; 5oN-15oN). The left (right) panels are results for 0-month (6-month) lead-time for standard seasons of summer (Figs. 4a-b), fall (Figs. 4c-d), winter (Figs. 4e-f) and spring (Figs. 4g-h). Note that over this region precipitation variance is high in all seasons (Fig. 1). Observations (red circles) indicate that during strong El Niño years (e.g., 1982-83; 1991-92; 1997-98), dryness or below normal rainfall persist from winter of Year [0] to summer of Year [+1]. Quite remarkably, CFS ensemble-mean forecast (blue circles) captures this drying persistence from 6-months lead time except for summer of Year [+1]. Except for the two strong El Niño events of 1982/83 and 1997/98, the spread among the ensemble members is large but the sign of the anomalies is well-captured. For 6-month lead forecast of JJA rainfall the predicted sign is wrong in many years. Table 2a lists the statistics at various leads and for all seasons. The ACC and S/N are high for winter and spring, but both drop off to low values for summer and fall (Table 2a). A possible interpretation is that large amplitude swings in precipitation occur during winter (Fig. 4a), and hence more predictable.
2. South Pacific Islands
Fig. 5 shows the results for the south Pacific islands (160oE-200oE; 10oS-30oS), and the skill statistics is summarized in Table 2b. In this region too, largest anomalies in precipitation are observed during ENSO winters (Figs. 5a-b) but the dryness starts in summer of Year [0] and persists until the following spring. Interestingly, CFS correctly captures both the phase and amplitude of the dryness at longer lead times. However, for any given season ACC and S/N do not exceed 0.7 and 2.0, respectively. Compared to other seasons, forecasting rainfall anomalies during summer is less skilful (Table 2b).
3. Hawaiian Islands
Another region of interest is the Hawaiian Archipelago (170oW-140oW; 15oN-30oN), and the precipitation forecasts are shown in Fig. 6 and the statistics are summarized in Table 2c. For the islands situated over the Northern Hemisphere, west Pacific and Hawaii, the dryness attains a maximum in winter of Year [0] and continues into the spring of Year [+1], and CFS has skill in forecasting them. However, the spread among the members is indeed large even during 1982-83 and 1997-98 El Niño years (Fig. 6) resulting in a low S/N (Table 2c). An analysis of ACC and RMSE for the USAPI regions for all leads and ICs (not shown) confirm the above results. Briefly, for both west Pacific and south Pacific regions high (low) ACC (RMSE) values at 5-6 months lead lie along the diagonal that represents winter and spring rainfall. However, rainfall anomalies over Hawaiian Islands appear least predictable at longer leads. From Figs. 4-6 it is encouraging to note that observed anomalies (red dots), generally lie within the envelope of possible model solutions (green dots), and there are few instances of outliers.
The APDRC may be acknowledged as follows: Data provided by
Asia-Pacific Data Research Center, |
Questions, Comments? |