Argo Products
 Raw profiles, interpolated and gridded fields, and velocity estimates (YoMaHa).
The progress of the IPRC/APDRC effort on analyzing and gridding the data of the global Argo array for the institutional use and for public distribution.
This dataset is not a final product, but a gradually developing (and hopefully improving) one. The project is intended to benefit from your feedback and is open to you at every stage.
Argo Products
Raw profiles, interpolated and gridded fields, and velocity estimates (YoMaHa).
The progress of the IPRC/APDRC effort on analyzing and gridding the data of the global Argo array for the institutional use and for public distribution.
This dataset is not a final product, but a gradually developing (and hopefully improving) one. The project is intended to benefit from your feedback and is open to you at every stage.
OGCM for the Earth Simulator (OFES)
 Through an on-going collaboration between JAMSTEC and the IPRC, the APDRC serves output from atmospheric, oceanic and coupled models run on the Earth Simluator, known as AFES, OFES and CFES, is provided by the Applications Laboratory (APL) at JAMSTEC.
Climate Indices
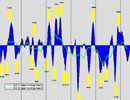 Up-to-date climate indices based on in-situ measurements and numerical models.
Hawaii Regional Forecast
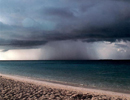 Forecast of
surface temperature, wind speed and direction, wave height and chance
of rain for the Hawaiian Islands provided by the National Weather
service. The data presented here is based on a forecast product from NOAA/NWS WFO in Honolulu. These web pages are an experimental service and should not be considered operational.
Forecast of
surface temperature, wind speed and direction, wave height and chance
of rain for the Hawaiian Islands provided by the National Weather
service. The data presented here is based on a forecast product from NOAA/NWS WFO in Honolulu. These web pages are an experimental service and should not be considered operational.
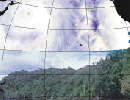
Hawaii Regional Climate Model (HRCM)
 This project is using the output from standard global climate models as the basis for much finer scale regional climate and climate change simulations for the main Hawaiian islands. We have configured a nested version of the advanced Weather Research and Forecasting (WRF) regional atmospheric simulation model with fine horizontal resolution for the Hawaiian region. We are performing simulations with this model that represent present day conditions and conditions near the end of the current century, assuming a given scenario for continued accumulation of greenhouse gases in the atmosphere.
Hawaii Regional Ocean Model
 This model extends the capability of a Global Ocean Data Assimilation Experiment (GODAE) model for the Hawaii region. The development of a regional ocean model for the waters surrounding the Hawaiian Islands at the IPRC is an extension of the effort by the multi-institutional HYCOM Consortium. The consortium is sponsored by the National Ocean Partnership Program (NOPP) as part of the U. S. Global Ocean Data Assimilation Experiment (GODAE) to develop and evaluate a data-assimilative hybrid isopycnal-sigma-pressure (generalized) coordinate ocean model (called Hybrid Coordinate Ocean Model or HYCOM).
Hawaii Regional Page
 This page is a clearing-house for observations and
public outreach efforts in the Hawaiian Island Region. This Hawaiian Archipelago Integrated Information Website serves as a comprehensive resource and clearing-house for weather and climate information.
This page is a clearing-house for observations and
public outreach efforts in the Hawaiian Island Region. This Hawaiian Archipelago Integrated Information Website serves as a comprehensive resource and clearing-house for weather and climate information.
High Wind Occurrence
 Global maps and data of high wind occurrence
over the ocean, based on QuikSCAT satellite measurements of sea winds. 0.25x0.25 degree QuikSCAT wind data from September 1999 through August 2006 are used to calculate the frequency of surface high winds stronger than 20 m/s.
Global maps and data of high wind occurrence
over the ocean, based on QuikSCAT satellite measurements of sea winds. 0.25x0.25 degree QuikSCAT wind data from September 1999 through August 2006 are used to calculate the frequency of surface high winds stronger than 20 m/s.
iROAM
 The IPRC Regional Ocean-Atmosphere
Model page. The climate of the eastern Pacific plays an important role in the El Niño-Southern Oscillation and thus in global climate. This region, though, has been notoriously difficult to simulate realistically in climate models. IPRC researchers have developed a model, the iROAM (IPRC regional ocean-atmosphere model) that couples the IPRC regional atmospheric model (IPRC Climate, Vol. 2, No. 2) with the GFDL Modular Ocean Model.
The IPRC Regional Ocean-Atmosphere
Model page. The climate of the eastern Pacific plays an important role in the El Niño-Southern Oscillation and thus in global climate. This region, though, has been notoriously difficult to simulate realistically in climate models. IPRC researchers have developed a model, the iROAM (IPRC regional ocean-atmosphere model) that couples the IPRC regional atmospheric model (IPRC Climate, Vol. 2, No. 2) with the GFDL Modular Ocean Model.
LADCP
 Vertical profiles of horizontal velocities as
part of the US CLIVAR/CO2 repeat hydrography program. The measurements of quasi-instantaneous vertical profiles of horizontal ocean velocities taken with a Lowered Acoustic Doppler Current Profiler (LADCP) as part of the US component of the CLIVAR/CO2 repeat hydrography program.
Vertical profiles of horizontal velocities as
part of the US CLIVAR/CO2 repeat hydrography program. The measurements of quasi-instantaneous vertical profiles of horizontal ocean velocities taken with a Lowered Acoustic Doppler Current Profiler (LADCP) as part of the US component of the CLIVAR/CO2 repeat hydrography program.
Mean Dynamic Ocean Topography
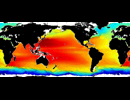 The sea
surface derived from jointly analyzed data of drifters, satellite
altimetry, wind and GRACE for the decade 1992-2002. The 1992-2002 MDOT is calculated using jointly data of satellite altimetry, near-surface drifters, NCEP wind and GRACE as described in Maximenko, N., P. Niiler, M.-H. Rio, O. Melnichenko, L. Centurioni, D. Chambers, V. Zlotnicki, and B. Galperin, 2009: Mean dynamic topography of the ocean derived from satellite and drifting buoy data using three different techniques. J. Atmos. Oceanic Tech., 26 (9), 1910-1919.
The sea
surface derived from jointly analyzed data of drifters, satellite
altimetry, wind and GRACE for the decade 1992-2002. The 1992-2002 MDOT is calculated using jointly data of satellite altimetry, near-surface drifters, NCEP wind and GRACE as described in Maximenko, N., P. Niiler, M.-H. Rio, O. Melnichenko, L. Centurioni, D. Chambers, V. Zlotnicki, and B. Galperin, 2009: Mean dynamic topography of the ocean derived from satellite and drifting buoy data using three different techniques. J. Atmos. Oceanic Tech., 26 (9), 1910-1919.
Monsoon Monitoring
 Daily updated monsoon indices based on Grid Pont Value
(GPV) data from Japan Meteorological Agency (JMA). All figures of today's circulation and each monsoon indices are based on Grid Pont Value (GPV) data from Japan Meteorological Agency (JMA). Please refer to this site in WMO Distributed Data Bases (DDBs) sever by JMA about its detail. All figures except for seasonal/monthly mean monsoon index are usually renewed at 01:00 (UTC) everyday. These up-to-date figures show the circulation map in the yesterday's 12:00(UTC), as indicated by %y4%m2%d2%h2 on top of each figures.
Daily updated monsoon indices based on Grid Pont Value
(GPV) data from Japan Meteorological Agency (JMA). All figures of today's circulation and each monsoon indices are based on Grid Pont Value (GPV) data from Japan Meteorological Agency (JMA). Please refer to this site in WMO Distributed Data Bases (DDBs) sever by JMA about its detail. All figures except for seasonal/monthly mean monsoon index are usually renewed at 01:00 (UTC) everyday. These up-to-date figures show the circulation map in the yesterday's 12:00(UTC), as indicated by %y4%m2%d2%h2 on top of each figures.
Pacific Argo Regional Center
 Quality
control of Argo data for the Pacific and Indian Ocean region is
underway to develop a mean climatology of the region based on these
floats. The Pacific Argo Regional Center (PARC) has been established as a joint collaboration between the Japan Marine Science and Technology Center (JAMSTEC), the International Pacific Research Center (IPRC) at the University of Hawaii, and the Commonwealth Scientific and Industrial Research Organisation (CSIRO). The PARC takes on the responsibility to validate all float data in the Pacific through rigorous scrutiny and to derive regional products based on these floats.
Quality
control of Argo data for the Pacific and Indian Ocean region is
underway to develop a mean climatology of the region based on these
floats. The Pacific Argo Regional Center (PARC) has been established as a joint collaboration between the Japan Marine Science and Technology Center (JAMSTEC), the International Pacific Research Center (IPRC) at the University of Hawaii, and the Commonwealth Scientific and Industrial Research Organisation (CSIRO). The PARC takes on the responsibility to validate all float data in the Pacific through rigorous scrutiny and to derive regional products based on these floats.
PRIDE
 Pacific Region Integrated Data Enterprise. This NOAA-based initiative is intended
to bring together all the data and research activities in the Pacific. PRIDE Vision: Advance NOAA's mission objectives and meet critical regional needs for ocean, climate and ecosystem information to protect lives and property, support economic development and enhance the resilience of Pacific Island communities in the face of changing environmental conditions.
Pacific Region Integrated Data Enterprise. This NOAA-based initiative is intended
to bring together all the data and research activities in the Pacific. PRIDE Vision: Advance NOAA's mission objectives and meet critical regional needs for ocean, climate and ecosystem information to protect lives and property, support economic development and enhance the resilience of Pacific Island communities in the face of changing environmental conditions.
Paleoclimate Modeling
 An Earth System Model of
Intermediate Complexity to study various aspects of Earth's climate
during the Late Quaternary period. The paleoclimate research activities at the IPRC under the leadership of Dr. Axel Timmermann utilize an Earth System Model of Intermediate Complexity (EMIC) to study various aspects of Earth's climate during the Late Quaternary period (Pleistocene-Holocene epoch). The research group employs the model LOVECLIM to better understand the mutual interactions among atmosphere, ocean, cryosphere, terrestrial vegetation, and the global carbon cycle on millennial and on orbital (Milankovitch) time scales.
An Earth System Model of
Intermediate Complexity to study various aspects of Earth's climate
during the Late Quaternary period. The paleoclimate research activities at the IPRC under the leadership of Dr. Axel Timmermann utilize an Earth System Model of Intermediate Complexity (EMIC) to study various aspects of Earth's climate during the Late Quaternary period (Pleistocene-Holocene epoch). The research group employs the model LOVECLIM to better understand the mutual interactions among atmosphere, ocean, cryosphere, terrestrial vegetation, and the global carbon cycle on millennial and on orbital (Milankovitch) time scales.
Precipitation Prediction System
 Dynamical prediction system for precipitation over the Pacific Islands. For all U.S. Affiliated Pacific Islands (USAPI), we have developed a prototype long range precipitation prediction system based on NOAA’s operational Climate Forecast System (CFS). Development of such a system is expected to fill a critical gap in the Climate Prediction Systems suite of operational forecasts for the USAPI that currently are purely derived based on empirical techniques. The vision of the Climate Test Bed (CTB) is to “significantly increase the accuracy, reliability, and scope of NOAA's suite of operational climate forecast products to meet the needs of a diverse user community”.
SCUD
 Surface CUrrents from Diagnostic model. Near-surface currents derived from satellite observations and consistent with trajectories of Lagrangian drifters. The goal of the project is to diagnose near-surface currents consistent with trajectories of Lagrangian drifters using satellite observations. Ocean currents are one of the variables that are most difficult for observations, both in situ and remote. Only satellites can provide global coverage continuous in time. Satellite-derived sea level topography and surface winds are utilized to optimize coefficients of the SCUD diagnostic model. The coefficients are tuned to best reproduce current velocities observed by standard drifters drogued at 15 meters depth.
Science on a Sphere & Magic Planet
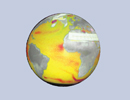 Spherical displays that allow one to visualize global data in a natural projection. Science On a Sphere (SOS) and Magic Planet are spherical displays that allow one to visualize global data in a natural projection. The technology is slightly different; the SOS projects images onto the surface of a 6-meter diameter sphere while the MP projects image inside a 24-inch sphere. Both can display animated, global images and make great educational tools that can help illustrate climate science to the general public.
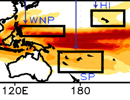
SPEArTC
 Southwest Pacific
Enhanced Archive of Tropical Cyclones, a high quality data set of tropical cyclones for the Pacific. This page is devoted to research concerning Tropical Cyclones in the Southwest Pacific – for the purposes of this research, the area of study is south of equator to about 40° South and stretches from near French Polynesia around 120° West and then west to the Gulf of Carpentaria in Australia at 135° East longitude.
Southwest Pacific
Enhanced Archive of Tropical Cyclones, a high quality data set of tropical cyclones for the Pacific. This page is devoted to research concerning Tropical Cyclones in the Southwest Pacific – for the purposes of this research, the area of study is south of equator to about 40° South and stretches from near French Polynesia around 120° West and then west to the Gulf of Carpentaria in Australia at 135° East longitude.
Statistical Downscaling
 IPCC Climate Scenarios for the Hawaiian Islands. We applied a statistical downscaling method in order find a connection between the large-scale atmospheric circulation over the Pacific (180-120W 10S-40N) with the rainfall over Hawaii. Using observational records of precipitation at individual rainfall stations across the Hawaiian islands, we first identified the circulation pattern that occurred during months with low and high precipitation at each single station during the last 50 years. In this study we only used the near surface winds. Especially, the strength and direction of the wind in north-south direction (e.g. Trade Winds, Kona Winds) is a useful indicator for low/heavy rainfall months in many parts of the Hawaiian Islands.
|