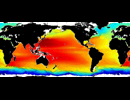
NOAA High-resolution Blended Analysis of SST and Ice, version 2.1. Data are from Sep 1981 (weekly and monthly) and is on a 1/4° global grid.
The Physical Sciences Division at NOAA has collected and made available weekly, monthly NOAA OI SST V2 data and monthly long-term mean from NCEP (Y. Xue) based on the V2.1 data. It is a high resolution Daily OISST using multi-satellite sensor (AVHRR+VIIRS) dataset.
Weekly Data
The optimum interpolation (OI) sea surface temperature (SST) analysis is produced weekly on a one-degree grid. The analysis uses in situ and satellite SST's plus SST's simulated by sea-ice cover. Before the analysis is computed, the satellite data is adjusted for biases using the method of Reynolds (1988) and Reynolds and Marsico (1993). The dates used represent the beginning of the 7-day average period.
Monthly Data
The NOAA OI.v2.1 SST monthly fields are derived by a linear interpolation of the weekly optimum interpolation (OI) version 2 fields to daily fields then averaging the daily values over a month. The monthly fields have the same spatial resolution as the weekly fields. The temporal coverage of the monthly data is from 1981/9 to near present
Monthly Long-term mean Data
A climatology based on these fields was derived by Yan Xue of the NCEP Climate Prediction Center following the technique of Reynolds and Smith (1995) and Smith and Reynolds (1998). The long term means are derived from data for years 1991 to 2020.
Reference:
Huang, B., C. Liu, V. Banzon, E. Freeman, G. Graham, B. Hankins, T. Smith, and H.-M. Zhang, 2021: Improvements of the Daily Optimum Interpolation Sea Surface Temperature (DOISST) Version 2.1, Journal of Climate, 34, 2923-2939. doi: 10.1175/JCLI-D-20-0166.1
Please note: If you acquire NOAA OI SST V2.1 High Resolution Dataset data products hwrw, we ask that you acknowledge PSL in your use of the data. This may be done by including text such as NOAA OI SST V2.1 High Resolution Dataset data provided by the NOAA PSL, Boulder, Colorado, USA, from their website at https://psl.noaa.gov in any documents or publications using these data. We would also appreciate receiving a copy of the relevant publications. This will help PSL to justify keeping the data freely available online in the future.
| Variables | SST (°C), Normalized Error Variance, Ice Concentration (%) |
| Zonal | 89.875S - 89.875N0.25 degree latitude (1440x720) |
| Meridional | 0.125E to 359.875E 0.25 degree longitude global grid (1440x720) |
| Vertical | Surface |
| Temporal | Weekly: Sept, 1981 to (present - 1 month) by 1 week Monthly: Sept 1981 to (present - 1 month) by 1 month Climatology: Monthly Long Term Mean: 1991-2020 |
| Static? | no |
| Volume | Weekly: 144MB per variable Monthly: 45MB per variable Climatology: 1.5MB per climatology period |
| Server | public:      |
| Source | https://psl.noaa.gov/data/gridded/data.noaa.oisst.v2.highres.html |
| Acquired | Nov 13, 2006 (Updated monthly on the 4th) |
| APDRC contact | |
| Supplements | Readme_oisst |


