
- Home
- New
- Data
All Datasets
Search by discipline
Search by data type
Search by temporal resolution
Search by time coverage
- Projects
Argo Products
 OFES
OFES Climate Indices
 Hawaii Regional Forecast
 Hawaii Regional Climate Model
 Hawaii Regional Ocean Model
 Hawaii Regional Page
 High Wind Occurrence
 iROAM
iROAM LADCP
LADCP Mean Dynamic Ocean Topography
 Monsoon Monitoring
 Pacific Argo Regional Center
 PRIDE
PRIDE Paleoclimate Modeling
 Precipitation Prediction System
 SCUD
SCUD Science on a Sphere
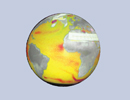
& Magic PlanetSPEArTC Statistical Downscaling
- Servers
Web-based servers
OPeNDAP servers
- Tutorials
- IPRC

Aquarius OISSS V5.0 (IPRC gridded products)
The IPRC now has two products based on the estimates of sea surface salinity from Aquarius. Aquarius is a satellite platform that is part of NASA’s Pathfinder mission. This satellite provides global observations of ocean surface salinity, flying 657 kilometers (408 miles) above Earth in a sun-synchronous polar orbit that repeats every seven days. Aquarius is mapping global changes in ocean surface salinity with a resolution of 150 kilometers (93 miles), showing how salinity changes from month to month, season to season and year to year.
Aquarius data may be obtained from NASA/JPL PO.DAAC. Here at the IPRC, Dr. Oleg Melnichenko and colleagues are producing different gridded products based on their analysis of the Aquarius data. These include
1. Global products: The IPRC has developed a global SSS estimate using the same OI procedure designed for SPURS [Melnichenko et al., 2014] with an additional step to correct SSS retrievals for large-scale satellite biases.
Digital data of the weekly OI SSS analysis from Aug 27, 2011 to May 28, 2015 are at
http://iprc.soest.hawaii.edu/users/oleg/oisss/glb/OISSS_V5.0_weekly/
Figures (weekly SSS maps) are here:
http://iprc.soest.hawaii.edu/users/oleg/oisss/glb/OISSS_PNG_5.0_weekly/
2. SPURS data products: The Salinity Processes in the Upper Ocean Regional Study (SPURS) was an in-situ campaign designed to study the role of the ocean in the global water cycle. A series of cruises, moorings, remote vehicles, etc. were coordinated in the salinity maximum region in the North Atlantic. Researchers are studying salinity changes that span thousands of miles simultaneously with those happening in one centimeter of water. SPURS is also providing much-needed data for computer models to improve our basic understanding of the water cycle over the oceans and its ties to climate. More information about SPURS can be found at http://spurs.jpl.nasa.gov/, and the raw data are available at various sites:
- TSG data
- PIRATA Moorings
- Drifter Data
- Aquarius Data
- Argo Floats
- AX7 XBT Lines
- AX8 XBT Lines
- AX20 XBT Lines
- Flux Mooring
- French Contribution to SPURS
- SPURS Drifter Portal at Scripps
- PMEL Prawler Mooring Graphics
- Prawler Mooring Visualization
The Aquarius team at the IPRC has also developed a weekly sea surface salinity product based on an Optimal Interpolation (OI) of the Aquarius measurements over the SPURS region. The analysis is intended to reduce the long-wavelength, inter-beam and ascending-descending biases which have been present in Aquarius data and improve the accuracy of SSS maps in the SPURS domain. The analysis is based on the newest Aquarius version 5.0 data and covers the period from September 2011 through May 2015. The weekly OI SSS data (netCDF files) can be downloaded from: http://iprc.soest.hawaii.edu/users/oleg/oisss/atl/OI_V5.0/. The description of the analysis as well as some graphical material can be found at http://iprc.soest.hawaii.edu/users/oleg/oisss/atl/.
Reference:
Melnichenko, O., P. Hacker, N. Maximenko, G. Lagerloef, and J. Potemra, 2014, Spatial Optimal Interpolation of Aquarius sea surface salinity: algorithms and implementation in the North Atlantic, J. Atmos. Oceanic Technol., 31, 1583–1600. doi: http://dx.doi.org/10.1175/JTECH-D-13-00241.1
Melnichenko, O., P. Hacker, N. Maximenko, G. Lagerloef, and J. Potemra (2015), Optimum interpolation analysis of Aquarius sea surface salinity, J. Geophys. Res. Oceans, 121, doi:10.1002/2015JC011343.
| Variables |
Sea Surface Salinity (psu)
|
| Zonal | Global: Global by 0.5 deg SPURS: 280.0 °E to 355.0 °E by 0.25 deg |
| Meridional | Global: Global by 0.5 deg SPURS: -1.0 °N to 41.0 °N by 0.25 deg |
| Vertical | Surface |
| Temporal | Global/SPURS weekly: Aug 27, 2011 to May 28, 2015 by 7 day(s) Global/SPURS monthly: Sep 2011 to May 2015 by 1 month(s) |
| Static? | Global: yes SPURS: yes |
| Volume | Global: 196 MB SPURS: 40 MB |
| Server | public:      |
| Source | http://iprc.soest.hawaii.edu/users/oleg/oisss/atl/ http://iprc.soest.hawaii.edu/users/oleg/oisss/glb/ |
| Acquired | Oct 17, 2014 (Updated July 2018) |
| APDRC contact | |
| Supplements |
The APDRC may be acknowledged as follows: Data provided by
Asia-Pacific Data Research Center, |
Questions, Comments? |