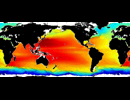
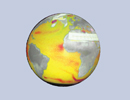
NOAA/NCEI 1/4 Degree Daily Optimum Interpolation Sea Surface Temperature (OISST) Analysis, Version 2.1
NOAAs 1/4-degree Daily Optimum Interpolation Sea Surface Temperature (OISST) (sometimes referred to as Reynolds SST, which however also refers to earlier products at different resolution), currently available as version v02r01, is created by interpolating and extrapolating SST observations from different sources, resulting in a smoothed complete field. The sources of data are satellite (AVHRR) and in situ platforms (i.e., ships and buoys), and the specific datasets employed may change over time. At the marginal ice zone, sea ice concentrations are used to generate proxy SSTs. A preliminary version of this file is produced in near-real time (1-day latency), and then replaced with a final version after 2 weeks. Note that this is the AVHRR-ONLY DOISST
The NOAA 1/4° daily Optimum Interpolation Sea Surface Temperature (or daily OISST) is an analysis constructed by combining observations from different platforms (satellites, ships, buoys and Argo floats) on a regular global grid. A spatially complete SST map is produced by interpolating to fill in gaps. The methodology includes bias adjustment of satellite and ship observations (referenced to buoys) to compensate for platform differences and sensor biases. This proved critical during the Mt. Pinatubo eruption in 1991, when the widespread presence of volcanic aerosols resulted in infrared satellite temperatures that were much cooler than actual ocean temperatures (Reynolds 1993). The latest version is OISST v2.1, released on March 16, 2020.
Major improvements from v2 to v2.1 include: 1) In-Situ ship and buoy data changed from the NCEP Traditional Alphanumeric Codes (TAC) to the NCEI merged TAC + Binary Universal Form for the Representation (BUFR) data, with large increase of buoy data included to correct satellite SST biases; 2) Addition of Argo float observed SST data as well, for further correction of satellite SST biases; 3) Satellite input from the METOP-A and NOAA-19 to METOP-A and METOP-B, removing degraded satellite data; 4) Revised ship-buoy SST corrections for improved accuracy; and 5) Revised sea-ice-concentration to SST conversion to remove warm biases in the Arctic region (Banzon et al. 2020).
OISST is an analysis constructed by combining observations from different platforms (satellites, ships, buoys and Argo floats) on a regular global grid. A spatially complete SST map is produced by interpolating to fill in gaps. The methodology includes bias adjustment of satellite and ship observations (referenced to buoys) to compensate for platform differences and sensor biases. This proved critical during the Mt. Pinatubo eruption in 1991, when the widespread presence of volcanic aerosols resulted in infrared satellite temperatures that were much cooler than actual ocean temperatures (Reynolds 1993).
In addition to OISST, the following are included on the same grid:
- Anomalies (i.e., the daily OISST minus a 30-year climatological mean) represent departures from "normal" or average conditions. Computation of several climate indices, such as the El Niño index, utilize SST anomalies.
- The error field provides a measure of confidence or quality, allowing users to exclude (using a threshold) or to minimize (using weights) the impact of daily OISST values with greater interpolation errors.
- The seven-day median of daily sea ice concentrations serves as the basis for proxy SSTs in the marginal ice zone, where observations are lacking. The proxy SST allows interpolation of temperatures from the open ocean to the seasonal sea ice margin.
Banzon, V., Smith, T. M., Chin, T. M., Liu, C., and Hankins, W., 2016: A long-term record of blended satellite and in situ sea-surface temperature for climate monitoring, modeling and environmental studies. Earth Syst. Sci. Data, 8, 165-176, doi:10.5194/essd-8-165-2016.
Dataset Citation:
Huang, B., C. Liu, V. Banzon, E. Freeman, G. Graham, W. Hankins, T. Smith, and H.-M. Zhang, 2020: Improvements of the Daily Optimum Sea Surface Temperature (DOISST) - Version 2.1, doi:10.1175/JTECH-D-19-0177.1
For a complete list of references, see OISST references.
You are encourage to register to receive news and updates by e-mail.
| Variables | SST (°C), SST anomaly (°C), SST error (°C), Sea ice concentration [%] |
| Zonal | Global by 0.25° |
| Meridional | Global by 0.25° |
| Vertical | surface |
| Temporal | Sep 1, 1981 to present by 1 day; Data less than 15 days old are considered preliminary and maybe updated. |
| Static? | no |
| Volume | ~600MB/year |
| Server | public:      |
| Source | https://www.ncdc.noaa.gov/oisst |
| Acquired | May 19, 2020 (Updated daily) |
| APDRC contact | |
| Supplements |


