Multi-Mission Optimally Interpolated Sea Surface Salinity Monthly Global Dataset V1.0
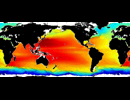
The multi-mission OISSS v1.0 product is level 4, near-global, 0.25 degree spatial grid, 7-day time scale, optimally interpolated sea surface salinity dataset based on the AQUARIUS/SAC-D, SMAP and SMOS level 2 mission data. This is a PI led dataset produced at the International Pacific Research Center (IPRC) of the University of Hawaii at Manoa in collaboration with the Remote Sensing Systems (RSS), Santa Rosa, California.
The dataset covers the period from September 2011 to the near present. The beginning segment, from September 2011 to June 2015, utilizes SSS data from the Aquarius/SAC-D satellite and is based on Optimum Interpolation (OI). The analysis uses a dedicated bias-correction algorithm to correct the satellite retrievals for large-scale biases with respect to in-situ data. The time series is continued with the SMAP SSS data provided by RSS. SMAP OISSS fields are produced from level 2 (swath) data using the OI algorithm. To ensure consistency and continuity in the data record, SMAP OISSS fields are further adjusted using a set of optimally designed spatial filters to reduce small-scale noise and, at the same time, to ensure that the data record is consistent across the scales. For the overlap period (April-May 2015), the data from the two satellites are combined together to ensure a smooth transition from one dataset to another. Measurements from ESA's Soil Moisture and Ocean Salinity (SMOS) satellite are used to fill the gap in SMAP observations during June-July 2019, when the SMAP satellite was in a safe mode and did not deliver scientific data.
The consistency and accuracy of the OISSS dataset have been evaluated against in situ salinity from Argo floats and moored buoys. The mean root-mean-square difference (RMSD) between the multi-mission OISSS dataset and concurrent in-situ data globally is around 0.19 psu. The product mean bias is around zero.
The description of the analysis as well as some graphical material can be found in OISSS Product Notes (pdf)
Monthly mean SSS
For each calendar month, the monthly mean SSS field is the mean of weekly OISSS fields
during the month.
Monthly climatological mean SSS
Monthly climatological mean SSS fields are computed by averaging the corresponding
monthly SSS fields over a 10-year period from September 2011 to August 2021.
Monthly SSS anomaly
Monthly SSS anomalies are determined by subtracting the corresponding monthly
climatological means. This procedure removes the mean seasonal cycle and returns month-
to-month inter-annual variations.
Further description of the monthly analysis can be found in Aquarius/SMAP sea surface salinity optimum interpolation analysis, IPRC Technical Note No. 7 (pdf)
Conditions of use. The data of Aquarius/SMAP SSS analysis are released for unrestricted public use and distribution.
Acknowledgments. Aquarius/SMAP combined SSS dataset is produced by the International Pacific Research Center (IPRC) of the University of Hawaii, in collaboration with Remote Sensing Systems (RSS), Santa Rosa, CA, and sponsored by the NASA Ocean Salinity Science Team.
To report errors and/or send comments, please contact
| Variables |
Sea surface salinity [1e-3], Estimated empirical uncertainty of multi-mission OISSS [1e-3], climatological SSS based on multi-mission OISSS dataset from 09/2011 to 08/2021 [1e-3], sea surface salinity anomaly relative to the product-based monthly climatology [1e-3]
|
| Zonal | Global: Global by 0.25 deg |
| Meridional | Global: Global by 0.25 deg |
| Vertical | Surface |
| Temporal | Global weekly: September 2011 to February 2022 by 1 month |
| Static? | no |
| Volume | ~1.9GB |
| Server | public:      |
| Source |
http://iprc.soest.hawaii.edu/users/oleg/oisss/GLB/ |
| Acquired | Jun 9, 2021 (updated May 2022) |
| APDRC contact | |
| Supplements | Aquarius/SMAP sea surface salinity optimum interpolation analysis, IPRC Technical Note No. 7 (pdf) |


