


The movements of air and water, ultimately expressed as extreme events, are governed by a myriad of processes operating across a broad range of spatial and temporal scales. At the global scale are large scale features of atmospheric and oceanic circulation driven by solar heating-induced temperature and pressure gradients and modified by the earth’s rotation or, in the case of the tides, driven by the gravitation pull of the moon and the sun. At the regional and local scale are features at intermediate and small scales such as atmospheric and oceanic currents and eddies, driven by similar processes and some more or less persistent in space and cyclical in time. Some of the key atmospheric and oceanographic features that affect extreme winds, rainfall, waves and water levels in the Pacific are identified below.
Large Scale Features of the Atmosphere
The Hadley Cell

A major component of atmospheric circulation initiated by the rising of air heated near the equator. As this warm tropical air ascends, it spreads out and moves towards the poles at high altitudes. Over a broad area centered at around 30 degrees north/south, it cools, then descends and moves across the surface back towards the equator. Twisted by the earth's rotation, it is this exchange of warm and cool air that accounts for the generation of the tropical easterly trade winds that occur at the surface between about latitude 30° and the equator in each hemisphere. Collectively, these motions sketch out a large-scale circulation cell when viewed as a vertical slice through the atmosphere taken along a line of longitude.
The rising limb of this circulation system, located on or near the equator, is known as the inter-tropical convergence zone (ITCZ). It is this rising limb, with its warm moist air and low pressure that is associated with cloud formation and heavy precipitation.
The falling limb of this circulation system, with its cold dry air and high pressure, is shared with an adjacent poleward atmospheric circulation system known as the Ferrel cell. Located between latitude 30° and 60° N, the prevailing westerlies are the surface winds associated with this cell.
Inter-Tropical Convergence Zone
The extensive solar heating in the maritime equatorial regions results in large moisture fluxes from the ocean into the air due to evaporation as well as a thermal pattern that sets the stage for rising motion to proceed along an axis that roughly parallels the equator. This feature is the ITCZ.
North Pacific High
A massive semi-permanent, quasi-circular high-pressure system, or subtropical anticyclone, centered around 30°– 40°N and 140°–150°W and associated with descending air from the Hadley Cell. Like all anticyclones in the Northern Hemisphere, owing to the earths rotation winds spiral outward from the center of high pressure in a clockwise direction.
This feature is one of several permanent surface high-pressure regions that extend around the earth in bands that roughly parallel the equator. This subtropical anticyclone constitutes a principal center of action in terms of sea level pressure.
Its presence has two important secondary effects. First, surface winds flowing out from these areas take up a right-hand deflection due to coriolis effect. The northeast to southwest flowing surface winds, to the south of the high, are called the trade winds. The northwest to southeast flowing surface winds, to the north of the high, are called the westerlies. Second, these features are dynamically driven and are so strongly manifested that their position and strength governs the tracks taken by tropical cyclones.
The North Pacific High shifts position and changes in intensity with the seasons. During the summer, it is located farther north and, on average, is larger, stronger and more persistent. During the winter it is located farther south, closer to the equator, and on average is smaller, weaker or even absent. Correspondingly, in the summer the easterly trade winds intensify and extend on average to 35°N and in the winter the prevailing westerlies reach as far south as 28°N.
Aleutian Low
A region of generally low pressure located near the Aleutian Islands, where sub-polar cyclones reach their maximum intensity. This feature also encompasses non-stationary systems of both low and high pressure (cyclones and anticyclones) that form and dissipate along fronts and rapidly move in a broad sub-polar band of west-to-east flowing air currents widely known as the prevailing westerlies.
There is no semi-permanent cyclonic vortex in this area that is akin to the major tropical high pressure features. However, when aggregated in a statistical fashion this region of low pressure constitutes a principal center of action.
The Aleutian Low shifts position and changes in intensity with the seasons. During the winter, it is located farther south, and is large, semi-permanent, and most intense. During the summer, it is located farther north, and is small and impermanent to nonexistent.
While not a dynamically directly-driven feature, the Aleutian Low still serves as a useful proxy for storm activity. Its position and size can be shown to be correlated with major indices such as ENSO, and in this manner it conveniently represents a mechanism for assessing impacts from teleconnection patterns.
Center of Action
Any one of the semi-permanent highs and lows that appear on mean charts of sea level pressure. Fluctuations in the nature of these centers are intimately associated with relatively widespread and long-term weather changes.
Atmospheric Rivers
Part of the "warm conveyor belt", a hemispheric cycle by which the cold, dry air of the Arctic flows southward, and warm, humid air from the tropics is forced northward. Atmospheric rivers play a key role in the formation of Pacific storms. Modeling studies concluded that more than 90% of the total water vapor transported toward the pole was concentrated into these rivers. They form a critical link between weather and climate scales. They strongly influence both short-term weather and seasonal climate patterns.
Pineapple Express (or Pineapple Connection)
A non-technical term for a meteorological phenomenon which is characterized by a strong and persistent flow of atmospheric moisture and associated heavy rainfall from the waters adjacent to the Hawaiian Islands and extending to any location along the Pacific coast of North America. A Pineapple Express is driven by a strong, southern branch of the Polar jet stream and is usually marked by the presence of a surface frontal boundary which is typically either slow or stationary, with waves of low pressure traveling along its axis. Each of these low pressure systems brings enhanced rainfall. The conditions are often created by the Madden-Julian oscillation, an equatorial rainfall pattern which feeds its moisture into this pattern. They are also present during an El Niño episode. Winds associated with a Pineapple Express traverse the mountain barrier associated with the entire North American Pacific coast where they are a heavy precipitation event on the windward side and a Chinook event on the lee.
Large Scale Features of the Ocean
Global Sea Level
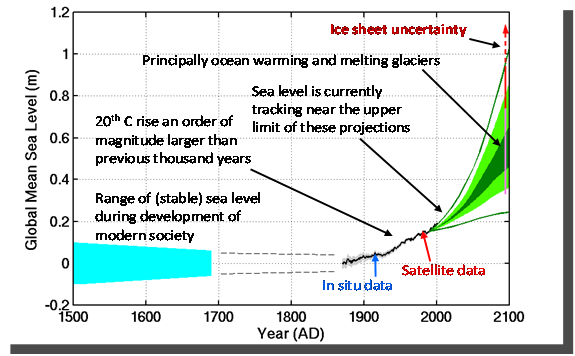
Global Sea Level Curve
(adapted from WCRP-IOC Sea Level Group, 2009)
The overall average elevation of the global ocean surface. Global mean sea level is determined by the volume of water in the ocean basin, with the volume controlled by the density of the water as well as the absolute amount of water in the ocean.
Sea level will rise if the density of the water decreases and fall if it increases. Changes in density occur in response to changes in ocean temperature and salinity. As water gets cooler or more salty it becomes denser and contracts. As it gets warmer or less salty it becomes less dense and expands (e.g., so-called thermal expansion). Sea level will rise if the amount of water in the ocean basin increases and fall if it decreases. Changes in the amount of water in the ocean are caused by freezing or thawing of ice sheets, glaciers, and ice caps, as well as losses to or contributions from other land water reservoirs.
Estimates obtained from analysis of land-based tide gauge records suggest that the global mean sea level rose at a rate of about 1.7 mm per year over the 20th century. Analysis of changes in the elevation of the entire global ocean surface obtained from satellite observations available since the early 1990s indicate that the global mean sea level rose at an accelerated rate of about 3.0 mm per year over the past decade.
For a variety of reasons, sea levels and rates of sea level rise exhibit considerable variations in both space and time. Different portions of the ocean are higher than others on an absolute basis because they are warmer or less salty on average. Over shorter-time scales non-uniform changes in temperature and salinity, and related to changes in the ocean circulation, result in spatial variability in the relative rates of sea level rise at a regional scale. Changes in atmospheric pressure and other weather-related phenomena such as storm surges affect sea level at both regional and local scales. The geologic setting, including tectonic uplift and subsidence, glacial isostatic adjustment, and rates of sedimentation, also influences sea levels and rates of sea level rise locally.
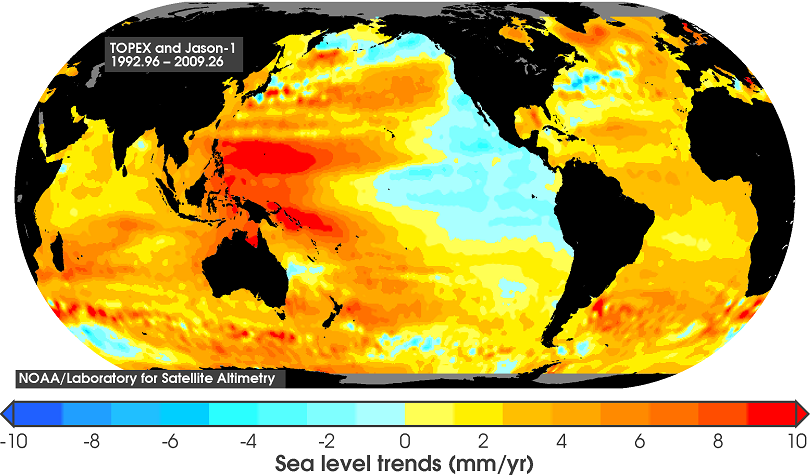
Trend of Sea Level Change based on the Satellite Record from 1992-2009.
Tides
Regular basin-wide motions of the ocean caused by the gravitation pull of the moon and the sun. This pull creates bulges of water on opposite sides of the Earth. A point on earth passes through these bulges twice a day, resulting in semidiurnal (half-daily) rising and falling of the ocean surface. Because the moon and the sun do not lie over the equator, one of the bulges is larger than the other, leading to diurnal (daily) component of the tide.
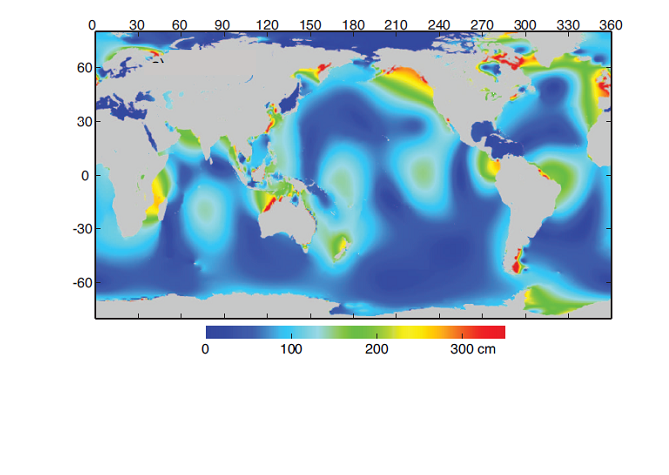
The average daily maximum tidal range computed from the TPXO6 global tide model using ten tidal constituents. The color scale is saturated; peak ranges can exceed 600 cm. Source Konotes et.al (in press).
Every month, during the full and new moons, the Sun, Moon, and Earth are in alignment. At this time their forces of the Sun and Moon act together to cause the tides to be particularly high and particularly low, and correspondingly the tidal range relatively high. The associated tides are called spring tides. Less pronounced tides that occur between the spring tides, when the Moon is in its first and last quarter, are called neap tides.
The moon’s orbit around the earth is not circular, but elliptical and because of this the moon is closer to the earth at some times than it is at others. When the moon is closest to the earth in its orbit it is called perigee. Even higher spring tides occur when the Moon happens to be at perigee in its orbit while simultaneously in line with the Earth and Sun. Termed perigean spring tides, they take place approximately every second spring tide.
The highest spring tides follow a semiannual cycle, occurring at the equinoxes or at the solstices. At the spring and fall equinoxes the sun and moon are both nearly in the earth’s equatorial plane, leading to peak semidiurnal tidal forces; at the winter and summer solstices the sun is at its maximum declination relative to the equator, leading to peak diurnal tidal forces. In many locations these semi-annual cycles play an important role in controlling extreme event water levels observed at the shoreline.
Basin-Wide Ocean Circulation

The main ocean currents involved with the North Pacific Gyre.
Large, basin-scale water motions driven primarily by oceanic temperature-density gradients, atmospheric circulation, and the rotation of the earth….
Geostrophic currents, the surface component of this so-called ocean conveyor belt or thermohaline circulation, form large-scale, circulating flows called gyres. These surface currents combine with currents driven by the wind to create more complicated regional flow patterns…
Examples include the North Equatorial Current – A broad region of uniform westward flow that forms the southern part of the Northern Hemisphere subtropical gyres driven by the trade winds; the North Equatorial Countercurrent – A band of eastward flow between the westward flowing North and South Equatorial Currents; and the North Pacific Current – A broad band of eastward flow that forms the northern part of the North Pacific subtropical gyre and feeds its water into the California Current on approaching the North American coast, and that is fed by the Kuroshio current, almost a Pacific counterpart to the Gulf Stream current, coming up from Japan.
Large Scale Patterns of Coupled Atmosphere-Ocean Variability
El Niño-Southern Oscillation (ENSO)
Quasi-cyclical, inter-annual changes in a number of coupled oceanic and atmospheric conditions across the Pacific, including differences in atmospheric pressures in an east-west direction along the equator through the tropics, its effect on the trade winds and, in turn, sea-surface temperatures (SST), sea-surface height (SSH), the position of the jet streams and storm tracks, and the location and intensity of rainfall.
Under “normal” conditions the trade winds blow towards the west across the tropical Pacific. This acts to pile up warm surface water in the west Pacific and bring cold water up from the depths in the east Pacific.
During El Niño conditions, the trade winds weaken and the warm water that has piled up during normal conditions is released and migrates east. Correspondingly, upwelling in the east Pacific is reduced. The result is that the eastern equatorial Pacific sea-surface temperatures (SST) are anomalously warm, a feature characteristic of an El Niño event. Sea surface heights (SSH) are elevated in this region of the ocean. Rainfall follows the warm water eastward, such that there is commonly flooding in the east Pacific while the west Pacific experiences drought.
The opposite effects tend to occur during La Niña conditions. The trade winds strengthen, warm water piles up to an even greater extent in the west Pacific, and upwelling in the east Pacific is enhanced. The result is that the eastern equatorial Pacific sea-surface temperatures (SST) are unusually cold, a feature characteristic of a La Niña event. Rainfall is found in rising air over the warmest water, such that the east Pacific is relatively dry.
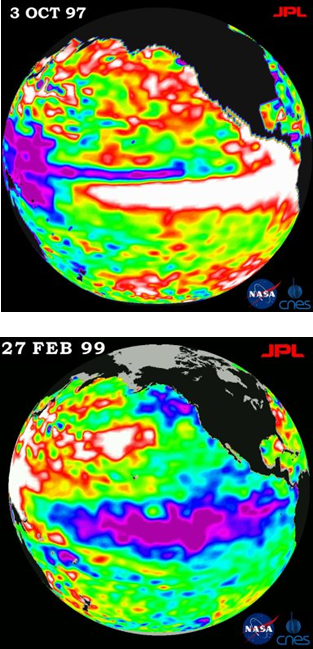
El Nino vs La Nina composite variations of sea surface height from the mean. On Oct. 3, 1997 the warm water associated with El Nino (in white) spreads northward along the entire coast of North America from the equator all the way to Alaska (top). On February 27, 1999 the low sea level or cold pool of water along the equator (shown in purple and blue), commonly referred to as La Nina, dominates the equatorial Pacific Ocean. Source http://www.nasaimages.org/
El Niño’s occur at irregular intervals ranging from approximately 2 to 7 years, and averaging about once every 3 to 4 years. La Niña occurs about half as often as El Niño. These so-called ENSO events generally persist for about 6 to 18 months.
The 1997–1998 El Niño was the largest on record in terms of SST anomalies and the global mean temperature in 1998 was the highest on record (at least until 2005).
The oscillation between El Niños to La Niñas can be characterized by environmentally-based indices, the simplest being the sea-surface water temperatures (SST) in the eastern equatorial Pacific. NOAA's Climate Prediction Center, which is part of the National Weather Service, declares the onset of an El Niño episode when the 3-month average sea-surface temperature departure exceeds 0.5oC in the east-central equatorial Pacific (between 5oN-5oS and 170oW-120oW). More advanced indices, such as the Multivariate ENSO Index (MEI), incorporate a number of surface marine observations. Specifically, the MEI is a weighted average of the six variables: sea-level pressure, the east-west and north-south components of the surface wind, SST, surface air temperature, and total amount of cloudiness. A value of the MEI above 0.5 denotes El Niño or “warm phase” conditions, and higher the value the stronger the intensity of the El Niño. MEI values below -0.4 denotes the occurrence of a La Niña or “cold phase” conditions.
El Niño-Southern Oscillation
http://www.cpc.ncep.noaa.gov/products/precip/CWlink/MJO/enso.shtml
http://www.pmel.noaa.gov/tao/elnino/nino-home.html
MEI
http://www.cdc.noaa.gov/enso/enso.mei_index.html
http://www.nwfsc.noaa.gov/research/divisions/fed/oeip/cb-mei.cfm
The Pacific Decadal Oscillation (PDO)
A multi-decadal cycle of coupled atmospheric-oceanic conditions characterized by alternating periods of dominance of El Niños versus La Niñas and corresponding changes in atmospheric circulation, ocean circulation, SST, SSH, etc. throughout the whole Pacific Basin. The PDO has been described as a long-lived El Niño like pattern of Indo-Pacific climate variability or as a low-frequency residual of ENSO variability on multi-decadal time scales. These so-called PDO phases tend to persist for 20 to 30 years.
It is generally agreed that a “cold” phase of more frequent La Niñas and fewer strong El Niños occurred from 1890 to 1924 and again from 1946 to 1976. “Warm” phase of more frequent, longer, and stronger El Niños occurred from about 1925 to 1946 and again from 1976 to 1998. During the 1976 to 1998 episode, cool conditions were observed in only 98 of 266 months. During this same warm phase of the PDO, both the equatorial and northern North Pacific oceans experienced two very large El Niño events (1983–1984 and 1997–1998). There were also two smaller events in 1986 and 1987 and a prolonged event from 1990 to 1995. A shift back to the cold phase appears to have commenced in 1999 and it is anticipated these conditions may persist for the next 20-30 years.
Key measures of such decadal variability of coupled atmospheric-oceanic conditions in the Pacific are the PDO index, the North Pacific Index (NPI), and the Inter-decadal Pacific Oscillation index. The PDO index is derived from sea surface temperature data. Specifically, it is defined as the pattern and time series of the first empirical orthogonal function of SST over the North Pacific north of 20°N. The NPI is defined as the average MSLP anomaly in the Aleutian Low over the Gulf of Alaska (30°N–65°N, 160°E–140°W). These are linked to decadal variations in atmospheric circulation, SST and ocean circulation throughout the whole Pacific Basin in the IPO.
Decadal to inter-decadal variability of the atmospheric circulation is most prominent in the North Pacific, where fluctuations in the strength of the winter Aleutian Low pressure system co-vary with North Pacific SST. In effect measures of the strength of the Aleutian low, the PDO and NPI serve as indicators of the strength of the westerlies blowing at mid to high latitudes across the Pacific and the intensities of extra-tropical storms that follow tracks generally from west to east. The NPI tends to vary on shorter time scales, interpreted in part as a bi-decadal rhythm, than the PDO. There is also reasonably strong correlation between the NPI and the MEI, even though their assessments incorporate environmental conditions at different latitudes.
Pacific Decadal Oscillation and NPI...and ALPI
http://www.nwfsc.noaa.gov/research/divisions/fed/oeip/ca-pdo.cfm
http://jisao.washington.edu/pdo/
Pacific-North American (PNA) Pattern
Wave-like patterns of circulation variability over the extra-tropical Pacific associated with anomalous tropical heating and emanating from the subtropical western Pacific.
Over the Northern Hemisphere in winter, the PNA pattern lies across North America from the subtropical Pacific, with four fixed centers of action. Correspondingly, the PNA pattern Index is defined as the mean of normalized 500 hPa height anomalies at 20°N, 160°W and 55°N, 115°W minus those at 45°N, 165°W and 30°N, 85°W. The PNA, or a variant of it, is associated with modulation of the Aleutian Low, the Asian jet, and the Pacific storm track, affecting precipitation in western North America and the frequency of Alaskan blocking events and associated cold air outbreaks over the western USA in winter. While PNA activity varies with decadal modulation of ENSO, no systematic changes in its behavior have been reported.
Pacific North American Pattern
http://www.cpc.ncep.noaa.gov/products/precip/CWlink/pna/pna.shtml
Madden-Julian Oscillation (MJO)
A quasi-periodic oscillation of the lower atmosphere near the equator, and characterized by an eastward progression of large regions of both enhanced and suppressed tropical rainfall observed mainly over the Indian Ocean and Pacific Ocean. Changes in atmospheric circulation and surface temperature around the global tropics and subtropics are also associated with the MJO. The period of the oscillation varies between about 30 and 60 days. As such, it is a major control on weather at intra-seasonal time scales.
The MJO is often quite variable, with periods of moderate-to-strong activity followed by periods of little or no activity. Overall, the MJO tends to be most active during ENSO neutral years, and is often absent during moderate-to-strong El Niño and La Niña events. Also, there is evidence which suggests that the MJO can contribute to the speed of development and intensity of El Niño and La Niña episodes.
Madden-Julian Oscillation
http://www.cpc.ncep.noaa.gov/products/precip/CWlink/MJO/mjo.shtml
Intermediate and Smaller Scale Features of the Atmosphere and Ocean
Tropical Cyclones
A powerful storm of symmetric nature that forms in tropical areas north and south of the equatorial belt (~10 deg N to ~10 deg S). In these areas coriolis effect is just strong enough to impart a rotational motion on an atmospheric disturbance and the near-surface ocean temperature (sea surface temperature, or SST) is high enough to ensure a large and steady supply of water vapor into the atmosphere via evaporation. The heat released as this evaporated water condenses within the storm represents its main source of energy. This important link to SST explains the strong spatial (Fig. 1 – TC formation zones) and seasonal patterns exhibited by these storms.
Once initiated in these formation zones a tropical cyclone (TC) will rapidly gain strength with the majority of systems reaching category N, with winds of XXXmph (Table 1). A typical trajectory consists of moving slowly to the west-northwest, transitioning gradually to more northerly motion that eventually gives over to a north-northeasterly motion (Fig. 2 –spaghetti plot of TC tracks and magnitudes). Progression of the TC north of ~50degrees north signals the beginning of a phase in the TC lifecycle called “ET-transistion”, or Extra-Tropical transition. Here the TC has begun to encounter the strong upper-level westerly flow of air and begins to lose its strong vertical symmetry that defines it morphorologically as a TC. Its wind speeds wane from their peak levels, however this TC “remnant” can provide a powerful boost to other systems moving over from Asia, described below, and remains a potent system in its own right.
Ocean Eddies
Intermediate, meso-scale rotational surface and sub-surface water motions. Commonly associated with large scale currents, like their cyclonic and anti-cyclonic atmospheric counterparts they form and dissipate along fronts and move across the ocean. At the ocean surface eddies may manifest as swirling areas of high or low temperature or salinity, or elevated or depressed water levels.
Coastal upwelling is a form of ocean eddy. It occurs when wind blows for many days over the relatively warm ocean surface and, in the Northern Hemisphere, the water moves to the right of the wind due to the earth’s rotation. To compensate for this, cold nutrient-rich water moves up from below the surface.
Another type of eddy, so-called mesoscale "anticyclonic" eddies are a major contributor to short-term sea level variability in the Pacific. These clockwise-rotating circulations of elevated water levels can propagate westward a significant distance across the Pacific Ocean at the latitude range of Hawaii and in the process dramatically impact sea levels locally.
Storm Surge
A short-term, often rapid and dramatic, rise in the coastal water level beyond the normal tidal level. Meteorological in origin, a storm surge can be caused by the passage of a low pressure system or by strong winds piling up water against the coast and often accompanies tropical cyclones.
Surface Gravity Waves
Small-scale, wind-generated gravity-driven motions of the water surface. Seas are formed locally from storm winds pushing water into complex patterns of waves of many periods and heights. The stronger the wind and the longer it lasts, the greater the height of the seas that are produced. As the waves move away from their source, they are sorted into regularly progressing swells that travel great distances across the ocean before they reach shallow depths near shore, become steep, eventually break, and then run-up on the beach.